Avient Announces Fourth Quarter and Full Year 2022 Results
February 15, 2023
- Fourth quarter and full year GAAP EPS from continuing operations of
$(0.19) and$0.90 - Fourth quarter and full year adjusted EPS from continuing operations of
$0.39 and$2.69 exceeds prior guidance of$0.29 and$2.60 due to better-than-expected orders for personal protection products from Avient Protective Materials ("APM") and cost reductions - On a pro forma basis, fourth quarter and full year adjusted EPS of
$0.42 and$3.04 exceeded prior guidance of$0.33 and$2.95 , respectively - Strong working capital performance to finish the year resulted in cash flow from operations of approximately
$400 million for 2022; full year free cash flow of approximately$290 million - Paid down additional
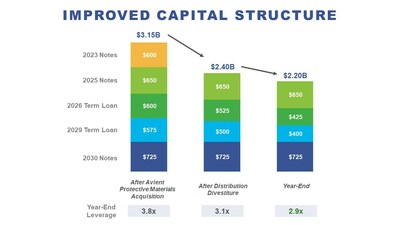
$200 million of debt for a year-end net debt-to-adjusted EBITDA of 2.9x which improved from prior projections - Earned fourth
Great Place to Work® certification, achieving the highest employee engagement scores in the history of the company
The company noted that GAAP EPS includes special items (Attachment 3) and intangible amortization expense (Attachment 1). Special items for the fourth quarter of 2022 had a
On a pro forma basis, fourth quarter and full year adjusted EPS were
"Orders in
"That being said, versus the prior year, global demand conditions and inventory destocking negatively impacted nearly every industry and region during the quarter,"
"I'm incredibly proud of the two transformational portfolio enhancements completed during 2022,"
"We have never wavered from our goal of becoming a specialty formulator. We have overhauled our portfolio by divesting more cyclical, less specialized businesses and made significant investments in innovation, composites, sustainable solutions and our
2023 Outlook
"As we begin 2023, we remain focused on executing our strategy, including integrating the APM business and being prudent and proactive in optimizing our cost structure," said
Non-GAAP Financial Measures
The Company uses both GAAP (generally accepted accounting principles) and non-GAAP financial measures. The non-GAAP financial measures include adjusted EPS, adjusted operating income, adjusted gross margin and adjusted EBITDA.
The Company does not provide reconciliations of forward-looking non-GAAP financial measures, such as adjusted EPS and adjusted EBITDA, to the most comparable GAAP financial measures on a forward-looking basis because the Company is unable to provide a meaningful or accurate calculation or estimation of reconciling items and the information is not available without unreasonable effort. This is due to the inherent difficulty of forecasting the timing and amount of certain items, such as, but not limited to, restructuring costs, environmental remediation costs, acquisition related costs, and other non-routine costs. Each of such adjustments has not yet occurred, are out of the Company's control and/or cannot be reasonably predicted. For the same reasons, the Company is unable to address the probable significance of the unavailable information.
To access
Pro Forma for Acquisition of Avient Protective Materials business (APM)
On
Comparisons to prior year fourth quarter and full year financial results herein are presented on a pro forma basis such that the prior periods include the business results of APM. Management believes this provides better comparability of the performance of the combined businesses. Refer to Attachment 7 Reconciliation of Non-GAAP Financial Measures for details regarding adjustments to previously reported results to arrive to the pro forma financial metrics.
Webcast Details
A recording of the webcast and the slide presentation will be available at avient.com/investors/events-presentations immediately following the conference call and will be accessible for one year.
About
- Dyneema®, the world's strongest fiber™, enables unmatched levels of performance and protection for end-use applications, including ballistic personal protection, marine and sustainable infrastructure and outdoor sports
- Unique technologies that improve the recyclability of products and enable recycled content to be incorporated, thus advancing a more circular economy
- Light-weighting solutions that replace heavier traditional materials like metal, glass and wood, which can improve fuel efficiency in all modes of transportation and reduce carbon footprint
- Sustainable infrastructure solutions that increase energy efficiency, renewable energy, natural resource conservation and fiber optic / 5G network accessibility
Forward-looking Statements
In this press release, statements that are not reported financial results or other historical information are "forward-looking statements" within the meaning of the Private Securities Litigation Reform Act of 1995. Forward-looking statements give current expectations or forecasts of future events and are not guarantees of future performance. They are based on management's expectations that involve a number of business risks and uncertainties, any of which could cause actual results to differ materially from those expressed in or implied by the forward-looking statements. They use words such as "will," "anticipate," "estimate," "expect," "project," "intend," "plan," "believe," and other words and terms of similar meaning in connection with any discussion of future operating or financial condition, performance and/or sales. Factors that could cause actual results to differ materially from those implied by these forward-looking statements include, but are not limited to: disruptions, uncertainty or volatility in the credit markets that could adversely impact the availability of credit already arranged and the availability and cost of credit in the future; the effect on foreign operations of currency fluctuations, tariffs and other political, economic and regulatory risks; the current and potential future impact of the COVID-19 pandemic on our business, results of operations, financial position or cash flows including, without limitation, any supply chain and logistics issues; changes in laws and regulations regarding plastics in jurisdictions where we conduct business; fluctuations in raw material prices, quality and supply, and in energy prices and supply; production outages or material costs associated with scheduled or unscheduled maintenance programs; unanticipated developments that could occur with respect to contingencies such as litigation and environmental matters; our ability to achieve strategic objectives and successfully integrate acquisitions, including Avient Protective Materials; an inability to raise or sustain prices for products or services; our ability to pay regular quarterly cash dividends and the amounts and timing of any future dividends; information systems failures and cyberattacks; amounts for cash and non-cash charges related to restructuring plans that may differ from original estimates, including because of timing changes associated with the underlying actions; and other factors affecting our business beyond our control, including without limitation, changes in the general economy, changes in interest rates, changes in the rate of inflation and any recessionary conditions. The above list of factors is not exhaustive.
Any forward-looking statement speaks only as of the date on which such statement is made, and we undertake no obligation to publicly update forward-looking statements, whether as a result of new information, future events or otherwise. You are advised to consult any further disclosures we make on related subjects in our reports on Form 10-Q, 8-K and 10-K that we provide to the
|
Attachment 1 |
||||||||
|
Avient Corporation Summary of Condensed Consolidated Statements of Income (Unaudited) (In millions, except per share data) |
||||||||
|
Three Months Ended |
Year Ended |
|||||||
|
2022 |
2021 |
2022 |
2021 |
|||||
|
Sales |
$ 790.4 |
$ 807.1 |
$ 3,396.9 |
$ 3,315.5 |
||||
|
Operating Income |
0.4 |
50.2 |
243.3 |
279.7 |
||||
|
Net (loss) income from continuing operations attributable to |
(17.0) |
11.2 |
82.8 |
151.8 |
||||
|
Diluted (loss) earnings per share from continuing operations attributable |
$ (0.19) |
$ 0.12 |
$ 0.90 |
$ 1.65 |
||||
|
Senior management uses comparisons of adjusted net income from continuing operations attributable to |
|
Three Months Ended |
|||||||
|
2022 |
2021 |
||||||
|
Reconciliation to Condensed Consolidated Statements of Income |
$ |
EPS(1) |
$ |
EPS(1) |
|||
|
Net (loss) income from continuing operations attributable to |
$ (17.0) |
$ (0.19) |
$ 11.2 |
$ 0.12 |
|||
|
Special items, after tax (Attachment 3) |
38.3 |
0.42 |
23.9 |
0.26 |
|||
|
Amortization expense, after-tax |
14.6 |
0.16 |
11.3 |
0.12 |
|||
|
Adjusted net income / EPS |
$ 35.9 |
$ 0.39 |
$ 46.4 |
$ 0.50 |
|||
|
(1) Per share amounts may not recalculate from figures presented herein due to rounding |
|||||||
|
Year Ended |
|||||||
|
2022 |
2021 |
||||||
|
Reconciliation to Condensed Consolidated Statements of Income |
$ |
EPS(1) |
$ |
EPS(1) |
|||
|
Net income from continuing operations attributable to |
$ 82.8 |
$ 0.90 |
$ 151.8 |
$ 1.65 |
|||
|
Special items, after tax (Attachment 3) |
116.2 |
1.26 |
50.0 |
0.54 |
|||
|
Amortization expense, after-tax |
49.0 |
0.53 |
44.9 |
0.49 |
|||
|
Adjusted net income / EPS |
$ 248.0 |
$ 2.69 |
$ 246.7 |
$ 2.68 |
|||
|
(1) Per share amounts may not recalculate from figures presented herein due to rounding |
|||||||
|
Attachment 2 |
||||||||
|
Condensed Consolidated Statements of Income (Unaudited) (In millions, except per share data) |
||||||||
|
Three Months Ended |
Year Ended |
|||||||
|
2022 |
2021 |
2022 |
2021 |
|||||
|
Sales |
$ 790.4 |
$ 807.1 |
$ 3,396.9 |
$ 3,315.5 |
||||
|
Cost of sales |
618.4 |
590.5 |
2,514.2 |
2,371.7 |
||||
|
Gross margin |
172.0 |
216.6 |
882.7 |
943.8 |
||||
|
Selling and administrative expense |
171.6 |
166.4 |
639.4 |
664.1 |
||||
|
Operating income |
0.4 |
50.2 |
243.3 |
279.7 |
||||
|
Interest expense, net |
(49.4) |
(17.5) |
(119.8) |
(75.2) |
||||
|
Other expense, net |
(28.4) |
(5.3) |
(59.7) |
(1.0) |
||||
|
(Loss) income from continuing operations before income taxes |
(77.4) |
27.4 |
63.8 |
203.5 |
||||
|
Income tax benefit (expense) |
60.8 |
(17.1) |
19.3 |
(51.9) |
||||
|
Net (loss) income from continuing operations |
(16.6) |
10.3 |
83.1 |
151.6 |
||||
|
Income from discontinued operations, net of income taxes |
561.5 |
18.7 |
620.3 |
79.0 |
||||
|
Net income |
544.9 |
29.0 |
703.4 |
230.6 |
||||
|
Net (income) loss attributable to noncontrolling interests |
(0.4) |
0.9 |
(0.3) |
0.2 |
||||
|
Net income attributable to |
$ 544.5 |
$ 29.9 |
$ 703.1 |
$ 230.8 |
||||
|
Earnings per share attributable to |
||||||||
|
Continuing operations |
$ (0.19) |
$ 0.12 |
$ 0.91 |
$ 1.66 |
||||
|
Discontinued operations |
6.17 |
0.21 |
6.80 |
0.87 |
||||
|
Total |
$ 5.98 |
$ 0.33 |
$ 7.71 |
$ 2.53 |
||||
|
Earnings per share attributable to |
||||||||
|
Continuing operations |
$ (0.19) |
$ 0.12 |
$ 0.90 |
$ 1.65 |
||||
|
Discontinued operations |
6.17 |
0.20 |
6.73 |
0.86 |
||||
|
Total |
$ 5.98 |
$ 0.32 |
$ 7.63 |
$ 2.51 |
||||
|
Cash dividends declared per share of common stock |
$ 0.2475 |
$ 0.2375 |
$ 0.9600 |
$ 0.8750 |
||||
|
Weighted-average shares used to compute earnings per common share: |
||||||||
|
Basic |
91.0 |
91.5 |
91.2 |
91.4 |
||||
|
Diluted |
91.0 |
92.4 |
92.2 |
92.1 |
||||
|
Attachment 3 |
||||||||
|
Summary of Special Items (Unaudited) (In millions, except per share data) |
||||||||
|
Special items (1) |
Three Months Ended |
Year Ended |
||||||
|
2022 |
2021 |
2022 |
2021 |
|||||
|
Cost of sales: |
||||||||
|
Restructuring costs, including accelerated depreciation |
$ (21.3) |
$ (6.0) |
$ (31.1) |
$ (14.6) |
||||
|
Environmental remediation costs |
(0.4) |
(0.5) |
(24.2) |
(22.9) |
||||
|
Reimbursement of previously incurred environmental costs |
— |
— |
8.3 |
4.5 |
||||
|
Acquisition related costs |
(23.8) |
0.6 |
(34.1) |
(0.6) |
||||
|
Impact on cost of sales |
(45.5) |
(5.9) |
(81.1) |
(33.6) |
||||
|
Selling and administrative expense: |
||||||||
|
Restructuring, legal and other |
(8.3) |
(4.2) |
(8.3) |
(5.9) |
||||
|
Acquisition related costs |
(6.1) |
(1.1) |
(19.3) |
(8.3) |
||||
|
Impact on selling and administrative expense |
(14.4) |
(5.3) |
(27.6) |
(14.2) |
||||
|
Impact on operating income |
(59.9) |
(11.2) |
(108.7) |
(47.8) |
||||
|
Interest expense, net - committed financing and debt extinguishment |
(16.0) |
— |
(26.0) |
— |
||||
|
Mark-to-market on derivatives |
— |
— |
(30.9) |
— |
||||
|
Pension and post retirement mark-to-market adjustment and other |
(28.4) |
(9.3) |
(28.4) |
(9.3) |
||||
|
Impact on Other expense, net |
(28.4) |
(9.3) |
(59.3) |
(9.3) |
||||
|
Impact on income from continuing operations before income taxes |
(104.3) |
(20.5) |
(194.0) |
(57.1) |
||||
|
Income tax benefit benefit/(expense) on above special items |
26.8 |
4.1 |
49.4 |
13.0 |
||||
|
Tax adjustments(2) |
39.2 |
(7.5) |
28.4 |
(5.9) |
||||
|
Impact of special items on net income from continuing operations |
$ (38.3) |
$ (23.9) |
$ (116.2) |
$ (50.0) |
||||
|
Diluted earnings per common share impact |
$ (0.42) |
$ (0.26) |
$ (1.26) |
$ (0.54) |
||||
|
Weighted average shares used to compute adjusted earnings per share: |
||||||||
|
Diluted |
91.7 |
92.4 |
92.2 |
92.1 |
||||
|
(1) |
Special items include charges related to specific strategic initiatives or financial restructuring such as: consolidation of operations; |
|
(2) |
Tax adjustments include the net tax benefit/(expense) from non-recurring income tax items, adjustments to uncertain tax position |
|
Attachment 4 |
||||||
|
Condensed Consolidated Balance Sheets (Unaudited) (In millions) |
||||||
|
Year Ended |
||||||
|
2022 |
2021 |
|||||
|
ASSETS |
||||||
|
Current assets: |
||||||
|
Cash and cash equivalents |
$ 641.1 |
$ 601.2 |
||||
|
Accounts receivable, net |
440.6 |
439.9 |
||||
|
Inventories, net |
372.7 |
305.8 |
||||
|
Current assets held for sale |
— |
360.2 |
||||
|
Other current assets |
115.3 |
119.9 |
||||
|
Total current assets |
1,569.7 |
1,827.0 |
||||
|
Property, net |
1,049.2 |
672.3 |
||||
|
|
1,671.9 |
1,284.8 |
||||
|
Intangible assets, net |
1,597.6 |
925.2 |
||||
|
Operating lease assets, net |
60.4 |
58.2 |
||||
|
Non-current assets held for sale |
— |
22.0 |
||||
|
Other non-current assets |
136.2 |
207.7 |
||||
|
Total assets |
$ 6,085.0 |
$ 4,997.2 |
||||
|
LIABILITIES AND SHAREHOLDERS' EQUITY |
||||||
|
Current liabilities: |
||||||
|
Short-term and current portion of long-term debt |
$ 2.2 |
$ 8.6 |
||||
|
Accounts payable |
454.4 |
429.5 |
||||
|
Current operating lease obligations |
17.0 |
21.1 |
||||
|
Current liabilities held for sale |
— |
141.3 |
||||
|
Accrued expenses and other current liabilities |
395.8 |
340.2 |
||||
|
Total current liabilities |
869.4 |
940.7 |
||||
|
Non-current liabilities: |
||||||
|
Long-term debt |
2,176.7 |
1,850.3 |
||||
|
Pension and other post-retirement benefits |
67.2 |
99.9 |
||||
|
Deferred income taxes |
342.5 |
100.6 |
||||
|
Non-current operating lease obligations |
40.9 |
37.3 |
||||
|
Non-current liabilities held for sale |
— |
13.1 |
||||
|
Other non-current liabilities |
235.5 |
164.8 |
||||
|
Total non-current liabilities |
2,862.8 |
2,266.0 |
||||
|
SHAREHOLDERS' EQUITY |
||||||
|
|
2,334.5 |
1,774.7 |
||||
|
Noncontrolling interest |
18.3 |
15.8 |
||||
|
Total equity |
2,352.8 |
1,790.5 |
||||
|
Total liabilities and equity |
$ 6,085.0 |
$ 4,997.2 |
||||
|
Attachment 5 |
||||
|
Condensed Consolidated Statements of Cash Flows (Unaudited) (In millions) |
||||
|
Year Ended |
||||
|
2022 |
2021 |
|||
|
Operating activities |
||||
|
Net income |
$ 703.4 |
$ 230.6 |
||
|
Adjustments to reconcile net income to net cash provided by operating activities: |
||||
|
Gain on sale of business, net of tax expense |
(550.1) |
— |
||
|
Depreciation and amortization |
157.6 |
144.2 |
||
|
Accelerated depreciation |
5.5 |
1.7 |
||
|
Amortization of inventory step-up |
34.4 |
1.5 |
||
|
Deferred income tax expense (benefit) |
0.5 |
(27.3) |
||
|
Share-based compensation expense |
13.2 |
11.2 |
||
|
Changes in assets and liabilities, net of the effect of acquisitions: |
||||
|
Decrease (increase) in accounts receivable |
32.6 |
(143.1) |
||
|
Decrease (increase) in inventories |
14.0 |
(141.0) |
||
|
Increase in accounts payable |
10.7 |
95.3 |
||
|
Increase (decrease) in pension and other post-retirement benefits |
7.1 |
(10.9) |
||
|
Taxes paid on gain on divestiture |
(2.8) |
— |
||
|
(Decrease) increase in accrued expenses and other assets and liabilities, net |
(27.7) |
71.6 |
||
|
Net cash provided by operating activities |
398.4 |
233.8 |
||
|
Investing activities |
||||
|
Capital expenditures |
(105.5) |
(100.6) |
||
|
Business acquisitions, net of cash acquired |
(1,426.1) |
(47.6) |
||
|
Settlement of foreign exchange derivatives |
93.3 |
— |
||
|
Proceeds from divestiture |
928.2 |
— |
||
|
Other investing activities |
6.1 |
(2.0) |
||
|
Net cash used by investing activities |
(504.0) |
(150.2) |
||
|
Financing activities |
||||
|
Debt offering proceeds |
1,300.0 |
— |
||
|
Purchase of common shares for treasury |
(36.4) |
(4.2) |
||
|
Cash dividends paid |
(86.8) |
(77.7) |
||
|
Repayment of long-term debt |
(956.8) |
(18.5) |
||
|
Payments on withholding tax on share awards |
(4.3) |
(10.7) |
||
|
Debt financing costs |
(49.3) |
— |
||
|
Other financing activities |
— |
(3.5) |
||
|
Net cash provided (used) by financing activities |
166.4 |
(114.6) |
||
|
Effect of exchange rate changes on cash |
(20.9) |
(17.3) |
||
|
Increase (decrease) in cash and cash equivalents |
39.9 |
(48.3) |
||
|
Cash and cash equivalents at beginning of year |
601.2 |
649.5 |
||
|
Cash and cash equivalents at end of year |
$ 641.1 |
$ 601.2 |
||
|
Attachment 6 |
|||||||
|
Business Segment Operations (Unaudited) (In millions) |
|||||||
|
Operating income at the segment level does not include: special items as defined in Attachment 3; corporate general and |
|||||||
|
Three Months Ended |
Year Ended |
||||||
|
2022 |
2021 |
2022 |
2021 |
||||
|
Sales: |
|||||||
|
Color, Additives and Inks |
$ 490.8 |
$ 581.3 |
$ 2,355.0 |
$ 2,401.6 |
|||
|
Specialty Engineered Materials |
300.8 |
226.3 |
1,044.4 |
911.6 |
|||
|
Corporate |
(1.2) |
(0.5) |
(2.5) |
2.3 |
|||
|
Sales |
$ 790.4 |
$ 807.1 |
$ 3,396.9 |
$ 3,315.5 |
|||
|
Gross margin: |
|||||||
|
Color, Additives and Inks |
$ 134.5 |
$ 164.5 |
$ 681.3 |
$ 727.5 |
|||
|
Specialty Engineered Materials |
82.4 |
58.3 |
283.7 |
250.9 |
|||
|
Corporate |
(44.9) |
(6.2) |
(82.3) |
(34.6) |
|||
|
Gross margin |
$ 172.0 |
$ 216.6 |
$ 882.7 |
$ 943.8 |
|||
|
Selling and administrative expense: |
|||||||
|
Color, Additives and Inks |
$ 90.2 |
$ 103.3 |
$ 380.3 |
$ 424.4 |
|||
|
Specialty Engineered Materials |
47.2 |
31.2 |
143.6 |
125.4 |
|||
|
Corporate |
34.2 |
31.9 |
115.5 |
114.3 |
|||
|
Selling and administrative expense |
$ 171.6 |
$ 166.4 |
$ 639.4 |
$ 664.1 |
|||
|
Operating income: |
|||||||
|
Color, Additives and Inks |
$ 44.3 |
$ 61.2 |
$ 301.0 |
$ 303.1 |
|||
|
Specialty Engineered Materials |
35.2 |
27.1 |
140.1 |
125.5 |
|||
|
Corporate |
(79.1) |
(38.1) |
(197.8) |
(148.9) |
|||
|
Operating income |
$ 0.4 |
$ 50.2 |
$ 243.3 |
$ 279.7 |
|||
|
Attachment 7 |
|||||||
|
Reconciliation of Non-GAAP Financial Measures (Unaudited) (In millions, except per share data) |
|||||||
|
Senior management uses gross margin before special items and operating income before special items to assess performance |
|||||||
|
Three Months Ended |
Year Ended |
||||||
|
Reconciliation to Consolidated Statements of Income |
2022 |
2021 |
2022 |
2021 |
|||
|
Sales |
$ 790.4 |
$ 807.1 |
$ 3,396.9 |
$ 3,315.5 |
|||
|
Gross margin - GAAP |
172.0 |
216.6 |
882.7 |
943.8 |
|||
|
Special items in gross margin (Attachment 3) |
45.5 |
5.9 |
81.1 |
33.6 |
|||
|
Adjusted Gross margin |
$ 217.5 |
$ 222.5 |
$ 963.8 |
$ 977.4 |
|||
|
Adjusted Gross margin as a percent of sales |
27.5 % |
27.6 % |
28.4 % |
29.5 % |
|||
|
Operating income - GAAP |
0.4 |
50.2 |
243.3 |
279.7 |
|||
|
Special items in operating income (Attachment 3) |
59.9 |
11.2 |
108.7 |
47.8 |
|||
|
Adjusted Operating income |
$ 60.3 |
$ 61.4 |
$ 352.0 |
$ 327.5 |
|||
|
Adjusted Operating income as a percent of sales |
7.6 % |
7.6 % |
10.4 % |
9.9 % |
|||
|
The table below reconciles pre-special income tax expense and the pre-special effective tax rate to their most comparable US |
|||||||||||
|
Three Months Ended |
|||||||||||
|
2022 |
2021 |
||||||||||
|
GAAP |
Special |
Adjusted |
GAAP |
Special |
Adjusted |
||||||
|
(Loss) income from continuing operations before income |
$ (77.4) |
$ 104.3 |
$ 26.9 |
$ 27.4 |
$ 20.5 |
$ 47.9 |
|||||
|
Income tax benefit (expense) - GAAP |
60.8 |
— |
60.8 |
(17.1) |
— |
(17.1) |
|||||
|
Income tax impact of special items (Attachment 3) |
— |
(26.8) |
(26.8) |
— |
(4.1) |
(4.1) |
|||||
|
Tax adjustments (Attachment 3) |
— |
(39.2) |
(39.2) |
— |
7.5 |
7.5 |
|||||
|
Income tax benefit (expense) |
$ 60.8 |
$ (66.0) |
$ (5.2) |
|
$ 3.4 |
|
|||||
|
Effective Tax Rate(1) |
78.5 % |
19.6 % |
62.4 % |
28.6 % |
|||||||
|
(1) Rates may not recalculate from figures presented herein due to rounding |
|||||||||||
|
Year Ended |
|||||||||||
|
2022 |
2021 |
||||||||||
|
GAAP |
Special |
Adjusted |
GAAP |
Special |
Adjusted |
||||||
|
Income from continuing operations before income |
$ 63.8 |
$ 194.0 |
|
|
$ 57.1 |
|
|||||
|
Income tax benefit (expense) - GAAP |
19.3 |
— |
19.3 |
(51.9) |
— |
(51.9) |
|||||
|
Income tax impact of special items (Attachment 3) |
— |
(49.4) |
(49.4) |
— |
(13.0) |
(13.0) |
|||||
|
Tax adjustments (Attachment 3) |
— |
(28.4) |
(28.4) |
— |
5.9 |
5.9 |
|||||
|
Income tax expense |
$ 19.3 |
$ (77.8) |
|
|
$ (7.1) |
|
|||||
|
Effective Tax Rate(1) |
(30.2) % |
22.7 % |
25.5 % |
22.7 % |
|||||||
|
(1) Rates may not recalculate from figures presented herein due to rounding |
|||||||||||
|
Three Months Ended |
Year Ended |
|||
|
Reconciliation of Pro Forma Adjusted Earnings per Share |
|
|||
|
Net (loss) income from continuing operations attributable to |
$ (17.0) |
$ 82.8 |
||
|
Special items, after tax (Attachment 3) |
38.3 |
116.2 |
||
|
Amortization expense, after-tax (Attachment 1) |
14.6 |
49.0 |
||
|
Adjusted net income from continuing operations excluding special items |
35.9 |
248.0 |
||
|
APM pro forma adjustments to net income from continuing operations* |
2.5 |
13.6 |
||
|
APM amortization expense, after tax* |
— |
19.1 |
||
|
Pro forma adjusted net income from continuing operations attributable to |
$ 38.4 |
$ 280.7 |
||
|
Weighted average diluted shares |
91.7 |
92.2 |
||
|
Pro forma adjusted EPS - excluding special items |
$ 0.42 |
$ 3.04 |
||
|
* Pro forma adjustment for January - |
||||
|
Reconciliation of Pro Forma Net Debt |
|
||
|
Short-term and current portion of long term debt |
$ 2.2 |
||
|
Total long-term debt, net |
2,176.7 |
||
|
Unamortized discount and debt issuance cost |
37.4 |
||
|
Total debt |
$ 2,216.3 |
||
|
Cash |
(641.1) |
||
|
Net taxes due from sale of business |
105.0 |
||
|
Adjusted cash |
$ (536.1) |
||
|
Net debt |
$ 1,680.2 |
||
|
Free Cash Flow Calculation |
|
||
|
Cash provided by operating activities |
398.4 |
||
|
Capital expenditures |
(105.5) |
||
|
Free cash flow |
$ 292.9 |
||
|
Reconciliation to EBITDA and Adjusted EBITDA |
Year Ended |
||
|
Net (loss) income from continuing operations – GAAP |
$ 83.1 |
||
|
Income tax (benefit) expense |
(19.3) |
||
|
Interest expense |
119.8 |
||
|
Depreciation and amortization from continuing operations |
162.5 |
||
|
EBITDA |
$ 346.1 |
||
|
Special items, before income tax |
194.0 |
||
|
Interest expense included in special items |
(26.0) |
||
|
Depreciation and amortization included in special items |
(5.5) |
||
|
APM pro forma adjustments - 8 months 2022* |
83.1 |
||
|
Adjusted EBITDA |
$ 591.7 |
||
|
* Pro forma adjustment for January - |
|||
![]()
![]() View original content to download multimedia:https://www.prnewswire.com/news-releases/avient-announces-fourth-quarter-and-full-year-2022-results-301747443.html
View original content to download multimedia:https://www.prnewswire.com/news-releases/avient-announces-fourth-quarter-and-full-year-2022-results-301747443.html
SOURCE
Investor Relations Contact: Giuseppe (Joe) Di Salvo, Vice President, Treasurer and Investor Relations, Avient Corporation, +1 440-930-1921, giuseppe.disalvo@avient.com; Media Contact: Kyle G. Rose, Vice President, Corporate Communications, Avient Corporation, +1 440-930-3162, kyle.rose@avient.com